Performance data
At St Christopher's Academy, we are committed to providing the best education for every child. Below, you can find a summary of our key performance data, including exam results, Ofsted ratings, and other important metrics. We believe in transparency and take pride in the progress and achievements of our students.
Department for Education - School Performance Tables
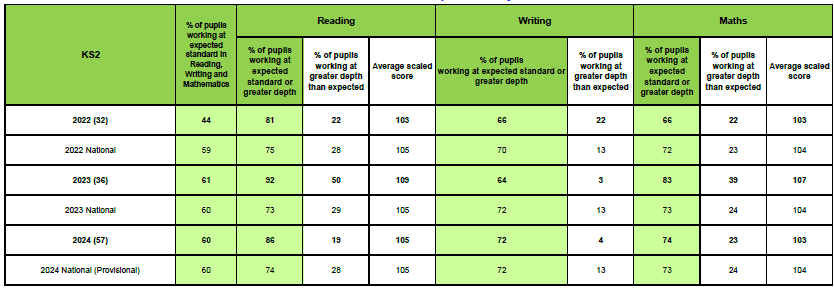
See below our year 6 SATs results for the past 3 years:
Subject-specific results:
-
Reading: 86% met the expected standard in 2024.
-
Writing: 72% met the expected standard in 2024.
-
Maths: 74% met the expected standard in 2024.
-
Grammar, Punctuation, and Spelling (GPS): 72% met the expected standard in 2024.
In all SATs-related subjects, the children of St Christophers Academy continue to perform above national average.
These results indicate a positive trend in pupil attainment across key subjects, reflecting the effectiveness of educational strategies and support systems implemented in our school.